What a 1-second chart shows
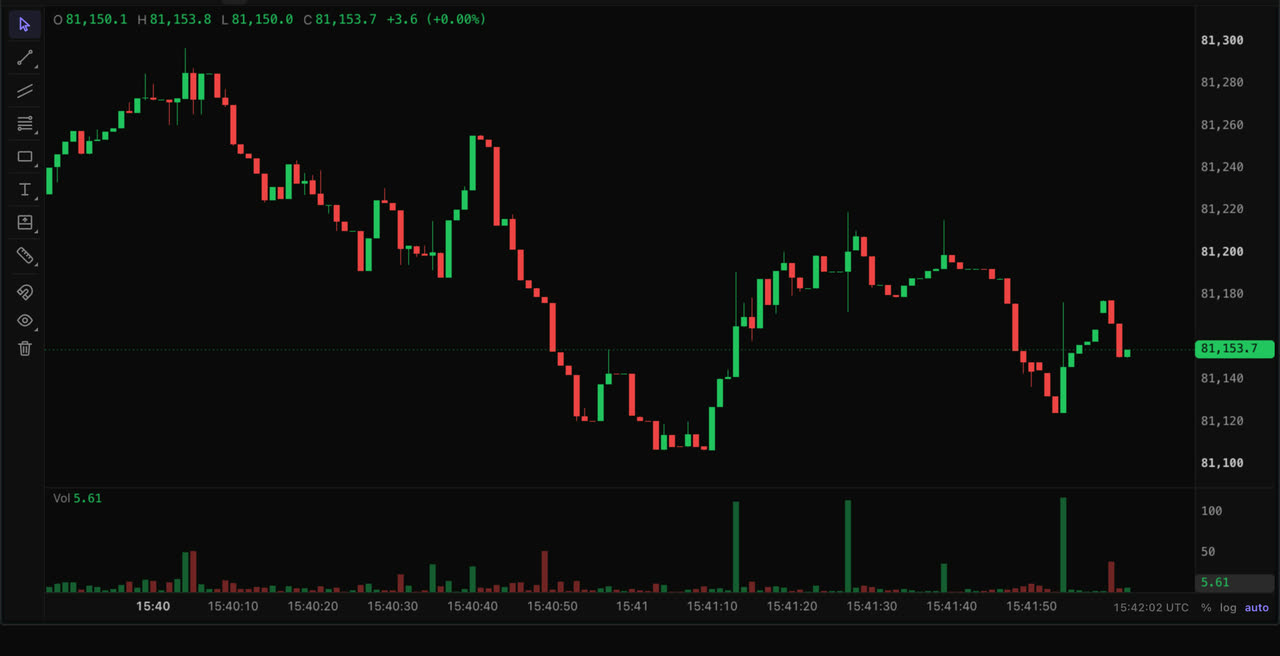
Each candle on a 1-second chart holds one second of trades: the first price, the highest, the lowest, the last, and how much traded. Five-, 10-, 15- and 30-second candles group those seconds into slightly calmer bars. Traders use them to time entries in fast markets, to see how a wick formed, and to read a burst of buying or selling as it happens.
One minute of BTC, second by second
At 15:23 UTC on 8 October 2026, Binance’s BTC/USDT 1-minute candle opened at 81,647.29, dipped to 81,346.01 and closed at 81,760.35. On a 1-minute chart that is a textbook hammer: a long lower wick and a close near the high. The 60 one-second candles inside it tell a more specific story.
- Price slid for 23 seconds before printing the low, 81,346.01, at 15:23:23.
- One second did a third of the minute’s trading. At 15:23:11, 85.75 BTC changed hands, out of 260.64 BTC for the whole minute, and price fell $121.84 in that single second.
- Price spent about four seconds near the low, then climbed back over the next 30 seconds and set the minute’s high, 81,774.34, at 15:23:53.
The 1-minute candle can’t tell you any of that. It can’t say whether the wick was a level that held for most of the minute or a few seconds of heavy selling, and that difference matters when you decide where a stop goes.
Where you can get 1-second charts
| 1-second candles | Cost | |
|---|---|---|
| TradingView | Plus, Premium and Ultimate plans only. Basic and Essential don’t include second-based intervals. | Plus is $29.95 a month on annual billing |
| The exchanges’ own data | Binance (spot) and Bybit publish 1-second candles. Binance’s futures API, Coinbase, Kraken, Hyperliquid and Lighter start at 1 minute. | Free, but raw data rather than a chart |
| WatchCrypto | 1s, 5s, 10s, 15s and 30s on supported markets, built from every trade | Free, no account needed to view |
TradingView’s plans read from tradingview.com/pricing on 8 October 2026, and its prices from the same page on 13 September 2026 (every tier is broken down here). Each exchange’s support checked against its public API on 8 October 2026.
How WatchCrypto builds them
- From every trade it receives, WatchCrypto builds 1-, 5- and 10-second candles, and adds 15- and 30-second candles up from those. On Binance spot it uses Binance’s own 1-second candles.
- For the 87 pairs it records around the clock across its seven exchanges, it keeps up to 7 days of 1-second candles and 30 days of 5- to 30-second candles.
- On any other market, opening the chart rebuilds the recent seconds from the exchange’s latest trades, from a few minutes on the busiest markets to over an hour on quieter ones. Every new trade is added live from then on.
- The timeframe menu offers seconds only where they exist, so you never open an empty chart.
One thing looks odd the first time: in a quiet market, many seconds trade at a single price, so their candles are flat dashes. That is the data, not a glitch. Busy markets fill almost every second.
How to open one
- Open the terminal or any chart page. Charts load without an account.
- In the bar above the chart, click 1s. The arrow beside the timeframes opens the full list: 1, 5, 10, 15 and 30 seconds, then minutes, hours and days.
- Leave it running. A new candle prints every second, and the order book and trade tape beside the chart show the same trades as they happen.
When 1-second charts help, and when they don’t
They help when timing matters more than direction: entries and exits in a fast market, reading a wick or a sudden burst of trading, and checking how far price moved while an order filled. They don’t tell you the trend. A day of 1-second candles is 86,400 bars, most of them noise, so most traders read a higher timeframe first and drop to seconds only to time the trade.
Frequently asked questions
Does TradingView have 1-second charts for free?
No. On TradingView, second-based intervals come only with the Plus, Premium and Ultimate plans. Basic and Essential don't include them (pricing page, checked 26 October 2026).
Which exchanges publish 1-second candles?
Among the exchanges WatchCrypto charts, Binance (spot) and Bybit publish 1-second candles in their public APIs. Binance's futures API, Coinbase, Kraken, Hyperliquid and Lighter start at one minute. WatchCrypto builds seconds candles from trades, so it can show them on markets whose exchange doesn't publish them.
How far back does a 1-second chart go?
On the 80 pairs WatchCrypto records around the clock, up to 7 days of 1-second candles and 30 days of 5- to 30-second candles. On other markets, from a few minutes to over an hour back when you open the chart, then live from there.
Are seconds charts free on WatchCrypto?
Yes. Every timeframe, including 1, 5, 10, 15 and 30 seconds, is free, and charts load without an account.
Can I trade from a 1-second chart?
Yes, on Hyperliquid and Bulk perpetuals. The order form sits beside the chart, and an account is needed only to place orders.
Related
- WatchCrypto vs TradingView — the full comparison.
- What TradingView’s free plan allows, tier by tier.
- CVD: cumulative volume delta — the buy and sell flow behind each candle.
- How to read an order book — what the seconds are trading against.